After a very wet May, 2018 decided to go the other way for July. We recorded only 1.11 inches of rain at Leslie Park's weather station during July. That is the lowest summer monthly total since 2012. Only seven days saw measurable rain and just one had over a tenth of an inch. The month was bookended with rain, as the first saw 0.06 inches and the 31st had 0.81. The storm on the 31st carried over into the next month, and the total was 1.14 inches. That brings the total for 2018 to 17.08 inches.
July had an average temperature of 73.5 degrees. The high temperature for the month was 95.1 (July 4th.) There were seven days with temps that got above 90 degrees. That makes 13 days already where the high was above 90. The lowest recorded temperature was 50.1 (7th)
Average windspeed for the month was 1.5 mph. The highest recorded sustained windspeed was 24 mph, on the 20th.
Wednesday, August 1, 2018
Thursday, July 12, 2018
June 2018 Weather Summary
June had an average temperature of 69.9 degrees. The high temperature for the month was 94.4 (June 17th. There were four days with temps that got above 90 degrees. That makes 6 days already where the high was above 90. (As I write this, four days in July have already reached the same mark...) The lowest recorded temperature was 45.4 (6th)
We recorded 2.19 inches of rain at Leslie Park's weather station during June. Eleven days saw measurable rain and seven had over a tenth of an inch. The highest rainfall on any day was just 0.53 inches. That brings the total for 2018 to 15.97 inches, which is about a half an inch above what we have recorded over the last 10 years.
We recorded 2.19 inches of rain at Leslie Park's weather station during June. Eleven days saw measurable rain and seven had over a tenth of an inch. The highest rainfall on any day was just 0.53 inches. That brings the total for 2018 to 15.97 inches, which is about a half an inch above what we have recorded over the last 10 years.
Average windspeed for the month was 1.6 mph. The highest recorded sustained windspeed was 25 mph, on the 13th.
Tuesday, June 5, 2018
Windy days and broken trees
On Friday, May 4th, the weather station at Leslie Park recorded sustained windspeeds of 38 mph. Unfortunately, this created a problem in the orchard between #6 and #8. Two of the original pear trees from Dr Leslie's orchard were blown over. Both were hollow and predated the golf course. The expected lifespan of a pear tree is around 50 years, so this is not a surprise.

One of the downed trees. You can see the other in the background.
You can read about our efforts to maintain the spirit of the orchard HERE. Basically, every year we try to replace around 10 of the pear trees. When the golf course was built, there was a 12 tree by 12 tree section that was left. This meant that at least 144 pear trees, plus around 25 cherry trees were a part of the golf course.
Ten years ago, there were less than 90 of these trees left. Now, through attrition of new trees and the death of the old trees, we have almost filled all of the empty spots.

A new pear tree next to the old stump.
On May 30th, the windspeeds only reached 28 mph, but that was enough to topple this old oak tree between #11 and #13.

It was kind of big.

And also hollow.

In this picture from 2103, you can see the lean that the tree had.
Due to the tree's size, we will not be able to do anything with the trunk until the ground is frozen. Until that point, the tree will remain were it fell. Luckily, it is mostly out of the way.
Friday, June 1, 2018
May 2018 Weather Summary
May had an average temperature of 65.5 degrees, up just over 25 degrees degrees from April. The month started with a bang, as our first high temperature above 80 occurred on the first of May. The high temperature for the month was 94.6 (May 28th, the second day in a row above 90.) There were twelve days above 80 and two above 90. The lowest recorded temperature was 39.6 (May 11th.)
We got 5.57 inches of rain at Leslie Park's weather station during May. The rain fell on 15 different days, with the largest amount coming on the 3rd (0.80 inches.) Twelve days saw more than a tenth of an inch of rain. The monthly total is not too much more than the average of 4.05 inches. When you dig a little deeper into the numbers, you can see why it seems so much wetter than normal. In 2014 and 2015, we had over 5 inches of rain for the month, but each month had two days of at least an inch and a half of rain. In 2011, the monthly total was 6.77 inches, but 3.3 inches came in one storm. This means that there was a lot of rain, followed by at least a couple of days to dry out. This year, we saw rain on the 2nd through the 4th. Then we had four days of no rain, followed by a seven day stretch of rain every day. Then three days to dry out, followed by 5 days of rain. Three more dry days, rain on one day, two days without precipitation and then we ended the month with rain on the last two days. The longest period without rainfall was four days. That brings the total for 2018 to 13.78 inches, which is about 2.5 inches above what we have recorded over the last 10 years.
Average windspeed for the month was 2.2 mph. The highest recorded sustained windspeed was 38 mph, on the 4th.
Monday, May 14, 2018
Renovation of #6, 7 and 8 (1995)
Some more photos of the 1995 renovation at Leslie Park. Previous editions can be found HERE and HERE.
The biggest improvements to come about during the renovation were centered around drainage. Some of the other improvements were smaller in scope, but impacted play-ability no matter how much rain occurred.
The fairways on #5 and #6 were severely sloped and did not have any flat areas. These two fairways were shaped in such a way as to offer a thoughtful, well struck shot to land on a moderately flat area.

The view from #6 tee before. The fairway slopes from left to right and has a ridge running across.

They have started to shape the ridge.

Here, the tee has been final graded and the fairway is taking shape.

The view from the tee in 2017. If you look closely, you can see the flag on the green, something that could not happen before the renovation.

On this picture of #7, you can see the new bunker in front of the green as well as the trench where the new irrigation line was laid.

#7 from 2016

Here is a before picture of where the current green on #8 is located. It is deceiving, because I don't think there was actually a pond here. It was just an area that held water after rains.

The old green was covered over and an actual pond dug out.

The new green taking shape. The area right above the man's head is about where the old green was.

The fairway was graded and shaped, as well.

#8 green in 2009.

A shot from behind the green in 2011.
Tuesday, May 1, 2018
April 2018 Weather Summary
As I write this monthly summary, the sun is out and the temperature is pushing 80. May is starting out quite different from April.
This April had an average temperature of 41.9 degrees, up almost 8 degrees degrees from March. This might seem like a lot, but for the past seven years, the average April temperature is 48.1. So we are over six degrees behind that mark. The high temperature was 74.1 (April 12th, which would also be the first time we had temperatures above 60, except for TWO days in February when we hit that number.) The lowest recorded temperature was 16.7 (April 12th.) Nineteen days had low temperatures below freezing (compared to 25 days in March) and every day got above 32 degrees for at least a little while.
We got 2.85 inches of rain at Leslie Park's weather station during April. The rain fell on 12 different days, with the largest amount coming on the 15th (0.84 inches.) Four days saw more than a tenth of an inch of rain. That brings the total for 2018 to 8.21 inches.
Average windspeed for the month was 3.5 mph. The highest recorded sustained windspeed was 33 mph, on the 4th.
Wednesday, April 18, 2018
A Little Behind
It is no secret that this Spring has not been very spring-like. I did some digging and found some comparisons to where we have been in the past.
Here are some photos I took on April 19th, 2010 compared to some that I took today.


Here are some photos I took on April 19th, 2010 compared to some that I took today.

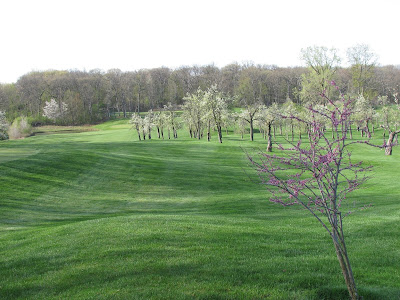
The Orchard in 2010.

The Orchard in 2018.

2010

2018.

2010.

2018. Make sure to look at that freshly painted barn, not at the snow.
If you look at the links on the right side of my blog, you will see the Growing Degree Tracker. This is a very helpful tool developed by Michigan State University that models plant maturity. It takes a base temperature and subtracts it from the average temperature for the day, ignoring negative numbers. Thus, the numbers always increase. There are many things that the GDD Tracker help turfgrass managers with. One of these is calculating Crabgrass pre-emergent timing. As you can see from the below graph, now is optimum timing for putting this out on your lawn.

The next graph shows where we sat one year ago.

Last year at this time, we were approaching the end of the window to apply pre-emergant. In 2014, we were visiting by the "Polar Vortex" and we opened Leslie Park on April 11th. We officially opened Leslie on March 30th this year, but it feels like this spring was worse.
Warmer temperatures are just around the corner though, I can feel it. Happy golfing.

Subscribe to:
Posts (Atom)